How can Canvas data help students?
Whiteboarding Canvas data into meaningful dashboards.
My Role
Design Lead
Product development from ideation to implementation
Managed an associate designer
User Research
Canvas LMS tracks and stores a massive amount of data about in-app student behavior, but unless an educational institution has a dedicated data analyst, it never sees the light of day.
Home page teacher experience
Our aim was to harness Canvas LMS data and transform it into a dashboard that could help teachers know how to help students who might be struggling before it’s too late. The product team (myself, an associate designer, and a PM) supported a data science team, a machine learning team, as well as backend and frontend engineers.
We initially had to solve data granularity. What do teachers want to see that’s actionable? We thought that something like this snapshot could be interesting (an easy first step for our data science and machine learning teams) but quickly realized that teachers of large, lecture-style courses could feel overwhelmed. We pushed harder for more actionable and complex insights.
Collaborating with our data science and machine learning team, we were able to pick out these 6 insights that teachers were genuinely interested in. Our AI model indicated that a student’s failure to access a course and lack of participation in learning activities were some of the most significant markers for failing a class. “Showing decline” was a combination of several factors, but equally important. We knew these metrics were essential to the app but also insisted we included an equal number of positive metrics to balance out the tone and make this tool a place that teachers would want to revisit.
The ability to focus on an individual student was critical to the overall mission of this product. We made this table view visible anytime a teacher clicked on a course, sorted to students needing attention at the top by default. When clicking on an individual student, a list of all of their most recent assignments pops up. We also made messaging prominent to encourage teachers to take action.
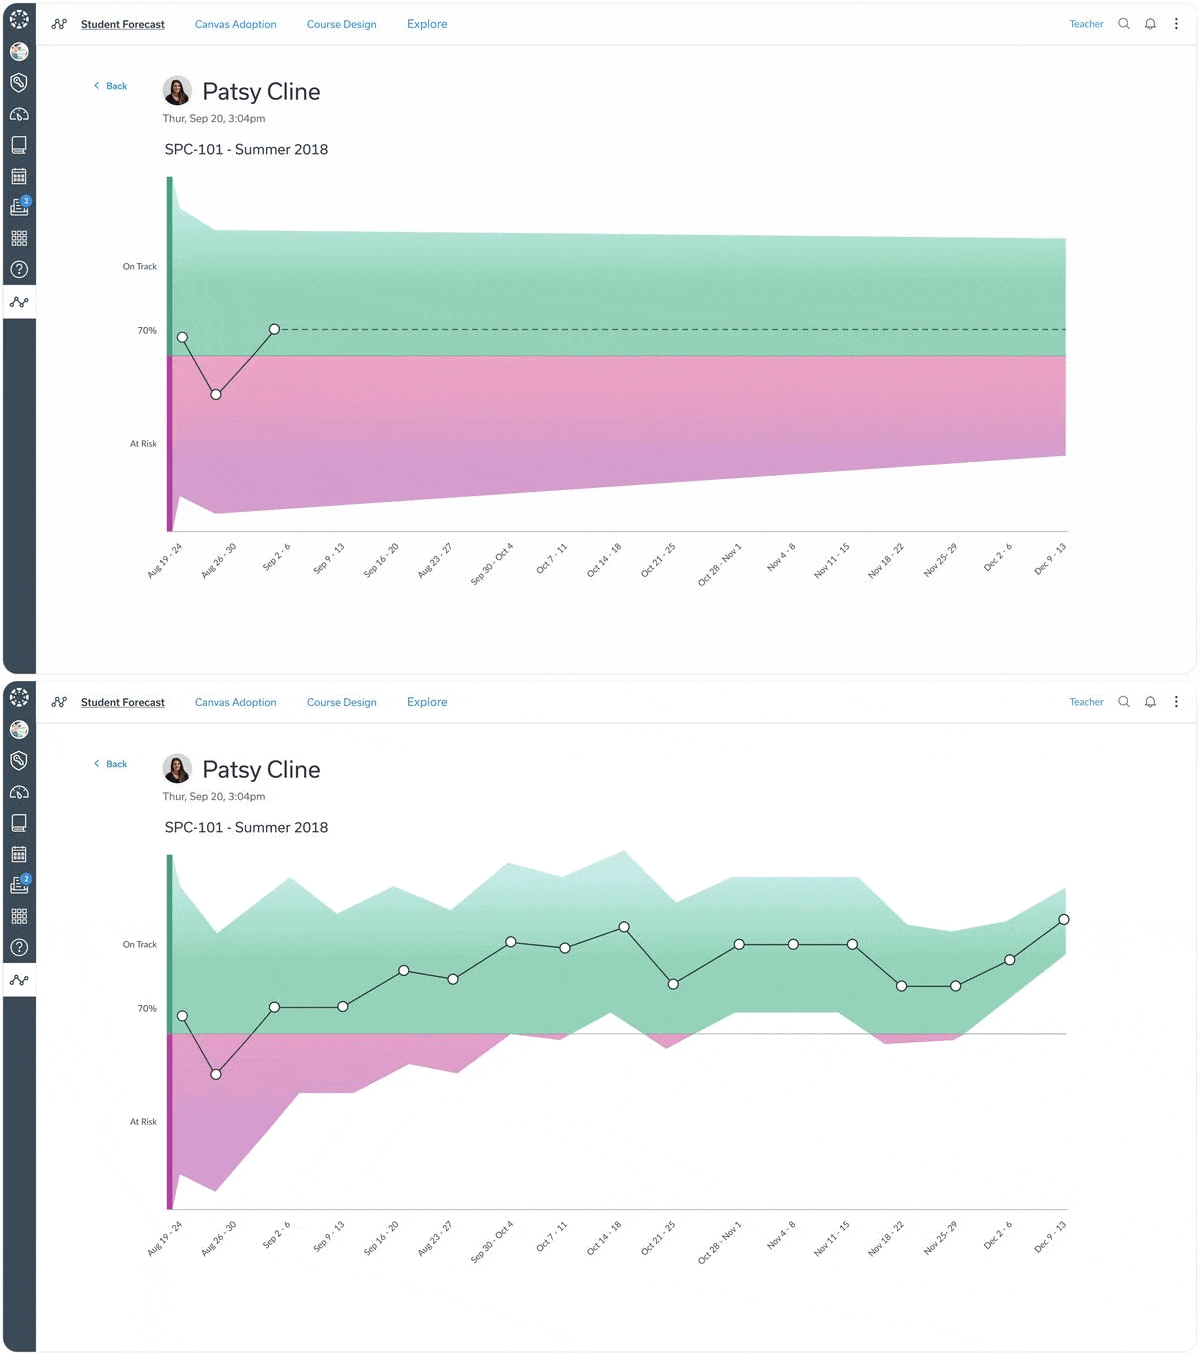
Teachers and students liked and easily understood this chart of the AI model confidence band changing to show progress over the course of the semester.


